Foreword
This document is a summary of selected 2016 pipeline safety data. It covers federally regulated pipelines only. Non-federally regulated data reported to the TSB are not included in this report.
The TSB gathers and uses this data during the course of its investigations to analyse safety deficiencies and identify risks in the Canadian transportation system.
The 2016 data were collected according to the reporting requirements described in the TSB Regulations in force during that calendar year.
The statistics presented here reflect the TSB database at 30 March 2017. Since the occurrence data are constantly being updated in the live database, the statistics may change slightly over time.
Also, as many occurrences are not formally investigated, information recorded on some occurrences may not have been verified.
A series of data tables associated with this annual summary is also available.
Pipeline system
In 2016, in the federally-regulated pipeline system, 42 companies, including 8 that transport both oil and gas, transported 196 million cubic metres (m3) of oil (1.2 billion barrels) along approximately 18 503 kilometres of oil pipelines. Seventy companies, including the 8 that transport both oil and gas, transported 183 billion cubic metres of natural gas (6.5 trillion cubic feet) along approximately 53 356 kilometres of natural gas pipelines.Footnote 1
Accidents
Overview of accidents
No pipeline accidents (Table 1) were reported to the TSB in 2016Footnote 2, the same as in 2015 but down from the annual average of 6 in the previous 5–year period (2011–2015) and 8 in the previous 10–year period (2006–2015)
Pipeline activity increased 3% from 2015Footnote 3. A general indicator of pipeline transportation safety in Canada is the pipeline accident rate. The 2016 rate (Table 2) was 0 pipeline accidents per exajouleFootnote 4, unchanged from 2015, and down from the annual average of 0.4 in 2011–2015 (Figure 1) and 0.6 in 2006–2015.
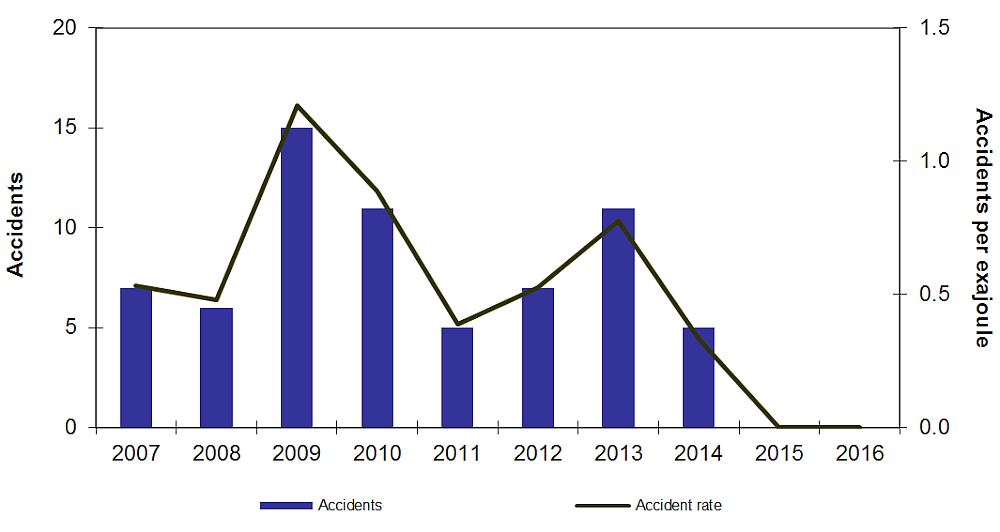
Figure 1 data table
| Year | Accidents | Accident rate |
|---|---|---|
| 2007 | 7 | 0.53 |
| 2008 | 6 | 0.48 |
| 2009 | 15 | 1.21 |
| 2010 | 11 | 0.89 |
| 2011 | 5 | 0.39 |
| 2012 | 7 | 0.53 |
| 2013 | 11 | 0.77 |
| 2014 | 5 | 0.33 |
| 2015 | 0 | 0.00 |
| 2016 | 0 | 0.00 |
Location of accidents: Over the past 10 years (2007–2016), 42% of pipeline accidents (Table 4) occurred at compressor stations and gas processing plants, and 28% occurred on transmission lines (Figure 2). The remaining pipeline accidents (30%) occurred at pump stations, terminals, meter stations, and on gathering lines.
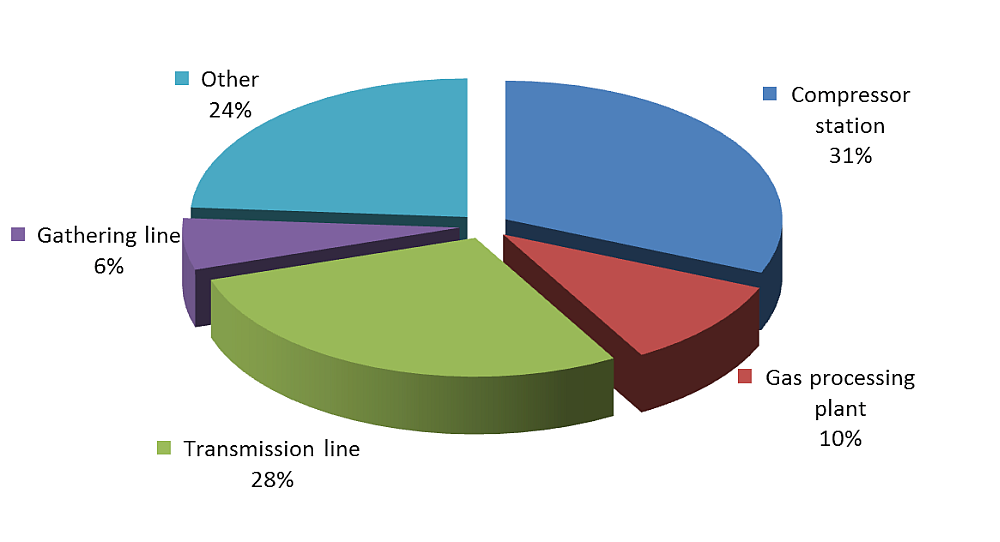
Figure 2 data table
| Facility type | Number | Percentage |
|---|---|---|
| Compressor station | 21 | 31.3 |
| Gas processing plant | 7 | 10.4 |
| Transmission line | 19 | 28.4 |
| Gathering line | 4 | 6 |
| Other | 16 | 23.9 |
Fatalities
There have been no fatal accidents on a federally regulated pipeline system directly resulting from the operation of a pipeline since the inception of the TSB.
Release of product
Although there were no accidents reported in 2016, over the past 10 years (2007–2016), 39 of the 67 occurrences identified as accidentsFootnote 7 (Table 5 & Table 6) resulted in a release of product. Natural gas was released in 19 accidents, with 6 releases of less than 1 cubic metre, 2 releases between 1 and 25 cubic metres, 1 releases between 26 and 1 000 cubic metres, and 10 releases over 1 000 cubic metres. Crude oil was released in 12 accidents, with 8 releases of less than 1 cubic metre (6.29 barrels (bbl)), and 4 releases between 26 and 1 000 cubic metres (between 157 and 6 290 bbl).
IncidentsFootnote 8
Overview of incidents
In 2016, 101 pipeline incidentsFootnote 9 (Table 1, Figure 3) were reported to the TSB, comparable to the 100 reported in 2015 but down from the annual average of 138 in the previous 5 years (2011–2015) and 116 in the previous 10 years (2006-2015). With the new TSB Regulations in effect starting 01 July 2014, there was a decrease in the number of reported incidents involving releases of low vapour pressure hydrocarbons from that date to the end of 2016.
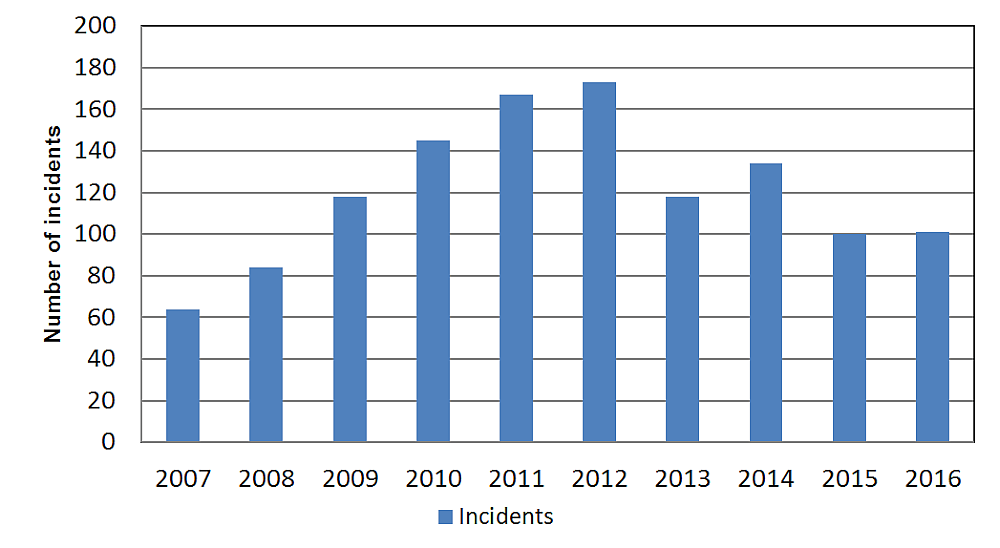
Figure 3 data table
| Year | Incidents |
|---|---|
| 2007 | 64 |
| 2008 | 84 |
| 2009 | 118 |
| 2010 | 145 |
| 2011 | 167 |
| 2012 | 173 |
| 2013 | 118 |
| 2014 | 134 |
| 2015 | 100 |
| 2016 | 101 |
Location of incidents
In 2016, 48% of pipeline incidents (Table 4) occurred on transmission lines, followed by 18% at meter stations, 12% at compressor stations, 8% at pump stations, 5% at terminals, and 3% at gathering lines. The remaining incidents occurred at gas processing plants, or at other facilities (Figure 4).
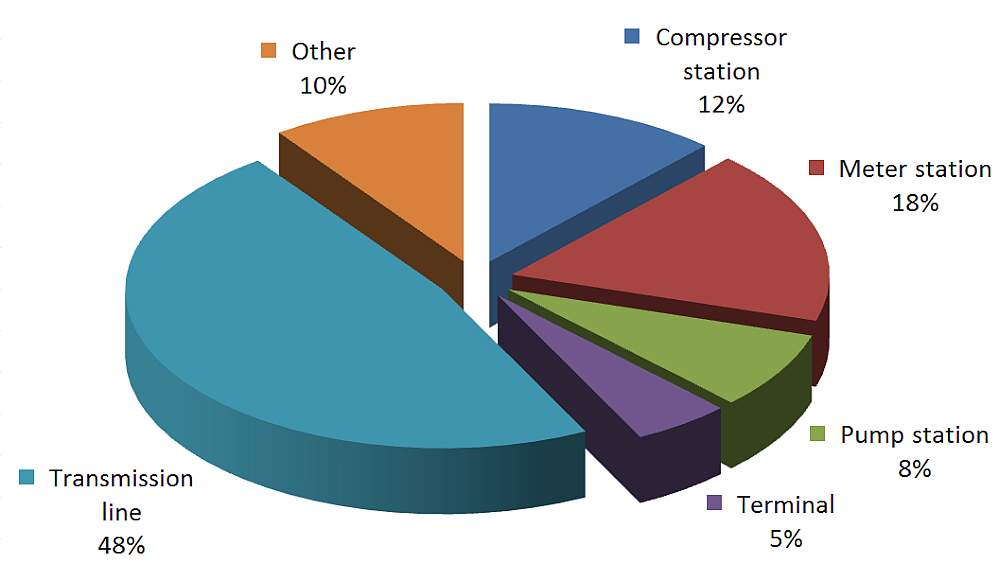
Figure 4 data table
| Facility type | Number | Percentage |
|---|---|---|
| Compressor station | 12 | 11.9 |
| Meter station | 18 | 17.8 |
| Pump station | 8 | 7.9 |
| Terminal | 5 | 5 |
| Transmission line | 48 | 47.5 |
| Other | 10 | 9.9 |
Release of product
In 2016, 57 incidents involved no release of product and 6 incidents involved a release of less than 1 cubic metre of natural gas (Table 1 and Table 6). Nineteen incidents involved a release of 1 to 25 cubic metres of natural gas, 7 incidents involved a release of 26 to 1 000 cubic metres of natural gas, and 4 incidents involved the release of over 1 000 cubic meters of natural gas. Two incidents involved a release of 1 to 25 cubic metres of sour gas, and 1 involved a release of 26 to 1 000 cubic metres of sulphur dioxide. One incident involved a release of 1 to 25 cubic metres of petroleum crude oil (Figure 5).
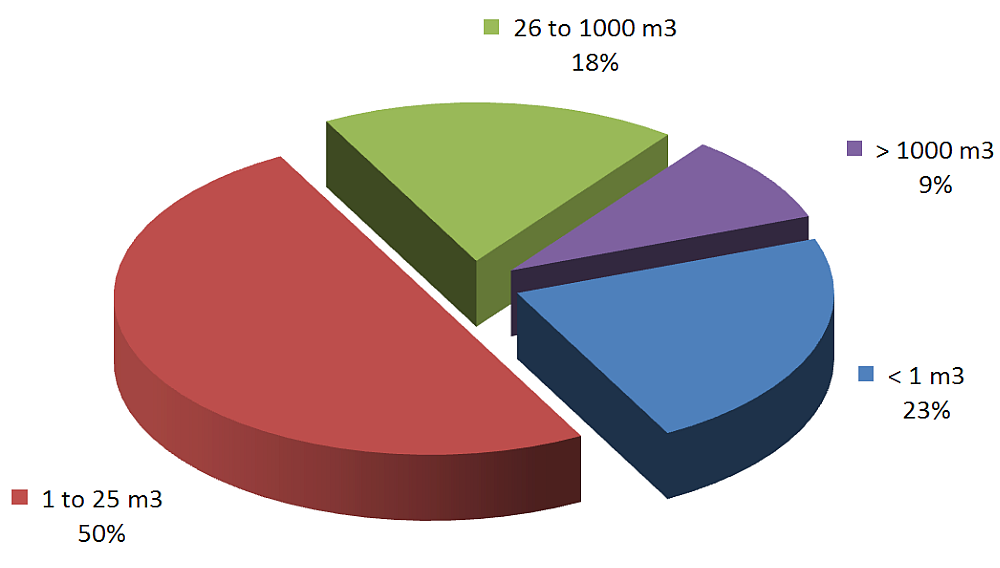
Figure 5 data table
| Quantity released | Number | Percentage |
|---|---|---|
| Nombre | Pourcentage | |
| < 1 m3 | 10 | 22.7 |
| 1 à 25 m3 | 22 | 50 |
| 26 à 1000 m3 | 8 | 18.2 |
| > 1000 m3 | 4 | 9.1 |
For reportable incidents, natural gas releases of less than 1 cubic metre decreased to 6 in 2016 from 11 in 2015. However, natural gas releases of 1 to 25 cubic metres increased to 19 in 2016 from 13 in 2015.
Crude oil releases of 1.5 cubic metres or more (9.44 barrels or more) decreased to 1 in 2016 from 3 in 2015.
Definitions
Pipeline accidents and incidents prior to 01 July 2014
Prior to July 2014 (previous TSB Regulations), pipeline accidents and incidents are defined as follow:
Pipeline accidents
Reportable commodity pipeline accident means an accident resulting directly from the operation of a commodity pipeline, where
- a person sustains a serious injury or is killed as a result of being exposed to
- a fire, ignition or explosion, or
- a commodity released from the commodity pipeline, or
- the commodity pipeline
- sustains damage affecting the safe operation of the commodity pipeline as a result of being contacted by another object or as a result of a disturbance of its supporting environment,
- causes or sustains an explosion, or a fire or ignition that is not associated with normal operationg circumstances, or
- sustains damage resulting in the release of any commodity.
Pipeline incidents
Reportable commodity pipeline incident means an incident resulting directly from the operation of a commodity pipeline, where
- an uncontained and uncontrolled release of a commodity occurs,
- the commodity pipeline is operated beyond design limits,
- the commodity pipeline causes an obstruction to a ship or to a surface vehicle owing to a disturbance of its supporting environment,
- any abnormality reduces the structural integrity of the commodity pipeline below design limits,
- any activity in the immediate vicinity of the commodity pipeline poses a threat to the structural integrity of the commodity pipeline, or
- the commodity pipeline, or a portion thereof, sustains a precautionary or emergency shut-down for reasons that relate to or create a hazard to the safe transportation of a commodity;
Pipeline occurrences after 01 July 2014
As of 01 July 2014, the new reporting provisions of the TSB regulations came into effect. According to section 4(1) of the TSB Regulations, the operator of a pipeline must report the following pipeline occurrences to the Board if they result directly from the operation of the pipeline:
- a person is killed or sustains a serious injury;
- the safe operation of the pipeline is affected by
- damage sustained when another object came into contact with it, or
- a fire or explosion or an ignition that is not associated with normal pipeline operations;
- an event or an operational malfunction results in
- an unintended or uncontrolled release of gas,
- an unintended or uncontrolled release of HVP hydrocarbons,
- an unintended or uncontained release of LVP hydrocarbons in excess of 1.5 m3, or
- an unintended or uncontrolled release of a commodity other than gas, HVP hydrocarbons or LVP hydrocarbons;
- there is a release of a commodity from the line pipe body;
- the pipeline is operated beyond design limits or any operating restrictions imposed by the National Energy Board;
- the pipeline restricts the safe operation of any mode of transportation;
- an unauthorized third party activity within the safety zoneFootnote 10 poses a threat to the safe operation of the pipeline;
- a geotechnical, hydraulic or environmental activity poses a threat to the safe operation of the pipeline;
- the operation of a portion of the pipeline is interrupted as a result of a situation or condition that poses a threat to any person, property or the environment; or
- an unintended fire or explosion has occurred that poses a threat to any person, property or the environment.
Pipeline accidents after 01 July 2014
For 2014 statistical reporting, pipeline accidents as of 01 July 2014 consist of reportable pipeline occurrences that resulted in:
- loss of human life;
- a serious injuryFootnote 11
- a fire or explosion that causes a pipeline or facility to be inoperative;
- a low vapour pressure hydrocarbon release in excess of 1.5 m³ that leaves company property or the right-of-way;
- a ruptureFootnote 12 ; or
- a toxic plumeFootnote 13.
Pipeline incidents after 01 July 2014
For 2014 statistical reporting, pipeline incidents as of 01 July 2014 consist of all reportable pipeline occurrences other than pipeline accidents.