ISSN 2561-2247
The original version was signed by
Kathleen Fox
Chair
Transportation Safety Board of Canada
The original version was signed by
The Honourable William Blair, P.C., C.O.M., M.P.
President of the Queen’s Privy Council for Canada and Minister of Emergency Preparedness
Chair's message
The end of fiscal year 2020–21 provides an opportunity to look back and take stock of the progress that the Transportation Safety Board of Canada (TSB) achieved on a number of fronts, including some of the unique challenges we faced.
To start with the obvious, the beginning of the fiscal year coincided with the rise of the global COVID-19 pandemic. As a result, just days into March 2020, our entire organization shifted suddenly to become a remote-working organization. Aided by the tremendous efforts of our IT team, our employees, managers, executives and Board all showed remarkable dedication and resilience. They adapted quickly and, over the next 12 months, continued our core work of investigating transportation occurrences and producing investigation reports—even deploying remotely on several occasions. Such was their level of efficiency and professionalism that by year’s end we had completed 66 investigations—one-third more than the previous year.
Our organization also witnessed several high-level personnel changes this year, among them the arrival of a new Board member following the retirement of another, and the onboarding of a new Director of Investigations for our Rail/Pipeline Branch.
We also continued our active involvement in the Iranian-led investigationFootnote i of the shootdown of Ukraine International Airlines flight 752, dedicating significant resources to try to find out what happened and why. In addition to sending investigators to visit the scene of the occurrence in Iran and to observe the subsequent download of the recorders in Paris, France, we liaised with other involved international investigation agencies, multiple departments within the Canadian government, and engaged with families of the victims. We also completed an assessment of the final investigation report by Iran’s Aircraft Accident Investigation Board which we discussed publicly at a news conference in March 2021. We continue to advocate actively for a review of the provisions of Annex 13 to the Convention on International Civil Aviation to improve the credibility and transparency of future safety investigations so that families and the public can have confidence in their findings and recommendations.
Another ongoing initiative that took a big step forward this year was the plan to build new, co-located facilities for our Head Office, currently in Gatineau, and our Engineering Laboratory currently located near the Ottawa/Macdonald-Cartier International Airport. We have now finalized a location—in this case, on the National Research Council of Canada’s Ottawa campus—and although shovels aren’t expected to be in the ground for some time, this latest step is nonetheless exciting!
Two other projects were also completed this year, each of which required significant work. The first of these was the release of our flagship communications product, the TSB Watchlist, which identifies the key safety issues that must be addressed to make Canada’s transportation system even safer. For Watchlist 2020,Footnote ii we’d seen enough progress that we were able to remove a previous Watchlist issue, that of Transport Canada’s slow progress addressing previous TSB recommendations. However, we also added a new issue, that of unplanned/uncontrolled movement of rail equipment; and split another, “safety management and regulatory oversight,” into separate issues to allow a greater focus on their individual elements.
The other significant activity was the publication of our new 5-year strategic plan (2021–2026). This document, which was the product of considerable internal consultation with staff, looks ahead to challenges we anticipate and sets out broad objectives for meeting them. Key elements such as being digital by default and using data to better drive our decisions will help us serve Canadians by finding efficiencies and better adapting to a world that moves faster by the hour. Meanwhile, by fostering an inclusive and respectful workplace and by placing a greater focus on employee mental health, we expect to better attract and retain experts who are among the best in their field so that we can continue to do the type of high-quality investigations that Canadians expect and rely on.
In closing, I am incredibly proud of how TSB employees have handled the events of the past year—and of what we have accomplished. Regardless of what came our way, all of our staff have responded with resilience, dedication and hard work, raising the bar on safety for Canadians from coast to coast to coast.
Kathleen Fox
Chair
Results at a glance
2020–21 Transportation Safety Board of Canada (TSB) Resource Utilization
- Financial: $36,373,762
- Human: 224 full-time equivalents
- The overall number of accidents in all modes reported in 2020 was 20% lower than the 2019 level, which is also 14% below the 10-year average.
- There were 42% fewer fatalities in 2020 across all transportation sectors than in 2019. This represents a 34% decrease from the 10-year average.
- In 2020–21, the TSB began 41 new investigations, completed 66 investigations and had 60 investigations in progress at year-end.
- The Board reassessed 12 outstanding recommendations as Fully Satisfactory and issued 3 new recommendations during 2020–21. This brings the TSB to an overall total of 84.5% of its recommendations assessed as Fully Satisfactory – a 1.5 percentage point increase compared to March 2020.
- Following the January 2020 downing of Ukraine International Airlines Flight 752, the TSB deployed 2 investigators to Tehran in 2019–20. In 2020–21, the TSB continued its active involvement, including observation of recorder downloads, liaising with other investigation agencies both internationally and within Canada, and engaging with families and victims. In March 2021, the TSB discussed its assessment of Iran’s Aircraft Accident Investigation Board’s final investigation report at a public news conference.
- In 2020–21, the TSB published its Watchlist 2020,Footnote iii which identifies eight key safety issues that require government and industry attention. This year’s edition includes several important updates from its last version published in 2018.
- The TSB moved to a digital environment at the start of the pandemic. In order to ensure that employees have the tools and resources necessary to work remotely without major disruption, the TSB made some updates to its IT infrastructure as well as shifted many of its processes and procedures to use various electronic tools and digital systems.
- The TSB is continuing its plan to move to a new co-located site on the National Research Council of Canada’s Ottawa Campus, with a planned move in the next few years. The TSB is engaging regularly with other departments and working groups as the plans continue to take shape.
For more information on the TSB’s plans, priorities and results achieved, see the “Results: what we achieved” section of this report.
Results: what we achieved
Core Responsibilities: Independent safety investigations and communication of risks in the transportation system
Description
The TSB’s sole objective is to advance air, marine, pipeline and rail transportation safety. This mandate is fulfilled by conducting independent investigations into selected transportation occurrences to identify the causes and contributing factors, and the safety deficiencies evidenced by these occurrences. The TSB makes recommendations to reduce or eliminate any such safety deficiencies and reports publicly on its investigations. The TSB then follows up with stakeholders to ensure that safety actions are taken to reduce risks and improve safety.
Results
The achievement of the TSB’s mandate is measured through three types of departmental result indicators. First, some performance indicators aim at reporting upon the overall safety of the transportation system. However, many variables influence transportation safety and many organizations play a role in this ultimate outcome. There is no way to directly attribute overall safety improvements to any specific organization. Accident and fatality rates are used as the best available indicators. In recent years, these indicators have generally reflected positive advancements in transportation safety and we expected similar results again in 2020–21.
The TSB’s departmental results are also measured through actions taken by its stakeholders in response to its safety communications, as well as through efficiency indicators. The TSB must present compelling arguments that convince “agents of change” to take actions in response to identified safety deficiencies. The responses received, the actions taken and their timeliness are good indicators of the TSB’s impact on transportation safety. The TSB actively engages with stakeholders in all modes. However, the established performance targets vary by mode to reflect the different baselines and the differing challenges from one mode to another. Good progress was made on a number of indicators during 2020–21. However, the TSB did not fully achieve all its targets for all performance indicators in all modes of transportation.
Serving Canadians
In 2020–21, the TSB continued to focus on improving timeliness of investigation reports without compromising on quality. This year, the TSB began 41 new investigations and completed 66 investigations of various classes.
There has been a slight increase in the average completion time of the various classes of investigations. The average completion time for the 9 complex class 2 investigations was 819 days, compared to 680 days for the complex class 2 investigation completed in 2019–20. For the 25 detailed class 3 investigations completed in 2020–21, the average completion time of 532 days was 39 days longer than the 493 days for the 22 detailed class 3 investigations completed in 2019–20. This year, 32 limited-scope class 4 investigations were completed in an average of 304 days, longer than the 228 days for the 26 limited-scope class 4 investigations completed in 2019–20.
With respect to responses to TSB recommendations, efforts continued to be made in collaboration with Transport Canada to review and take appropriate actions to close some older recommendations that have been outstanding for much too long. A particular focus was placed on aviation recommendations given the larger number of outstanding recommendations in that mode. In 2020–21, a total of 62 recommendations were reviewed, resulting in 12 recommendations being reassessed as Fully Satisfactory, which brought the overall total of Fully Satisfactory recommendations to 84.5%. The TSB also continued its outreach activities to engage stakeholders in proactive discussions and encourage them to initiate safety actions that can mitigate the risks identified. The TSB issued its Watchlist 2020 in the Fall. This edition of the Watchlist incorporates, among other inputs, the feedback received as part of a successful Watchlist mid-cycle consultation with industry stakeholders that took place in 2019–2020.
The TSB acknowledges the Government of Canada’s commitment to a renewal of the nation-to-nation relationship with Indigenous Peoples, as well as the commitment to make the recognition and implementation of rights the basis for all relations between Indigenous Peoples and the federal government. The TSB has examined and updated its own interaction with Indigenous Peoples in keeping with the Principles respecting the Government of Canada’s relationship with Indigenous Peoples. The TSB continued to equip its employees with tools and training to improve awareness of ways to engage and interact with First Nations, Inuit, and Métis Peoples in the delivery of its mandate.
Improving core business processes and products
In 2020–21, the TSB implemented amendments to the Policy on Occurrence Classification, including changes to its products and processes such as the removal of the requirement to produce post-deployment occurrence summaries for data -gathering class 5 investigations. The removal of this product enables the TSB to better utilize its resources to achieve its mandate of advancing transportation safety.
The TSB continued the review and modernization of tools for investigators, such as the Safety Communications Tracking Tool and the Integrated Safety Investigation Methodology System. Over the past few years, the TSB has conducted surveys with stakeholders in order to collect meaningful feedback on improving its products and services.
In 2020–21, the TSB analyzed feedback received from surveys with stakeholders to improve its products and services. Time to complete investigations and publish reports was one of the top identified comments. The TSB made substantial adjustments to its editing and translation processes to help accelerate release timelines. The TSB made changes to its Outreach plan to reflect current virtual opportunities and standardize its messaging. Safety findings and recommendations were incorporated into Outreach plans to generate discussion with stakeholders. Furthermore, its participation at industry events has been promoted on social media to increase awareness. Finally, to address comments received on the website user experience, the TSB made its site more mobile friendly and reviewed its use of meta tags to improve search engine optimization.
Modernizing
In 2020–21, the TSB continued to implement initiatives aimed at modernizing its workplace to facilitate teamwork, leverage the benefits of technology and achieve the best possible outcomes, focusing on efficient processes, structures and systems. Notably, the TSB fully implemented the GC mandated system for electronic document management (GCdocs) for all non-investigation files. The TSB also continued efforts to develop a single Project Tracking Tool that will replace the multiple independent applications currently used to manage projects by different branches within the organization. Major investments were made to acquire current IT tools, thereby providing employees with the flexibility to work from anywhere.
The TSB continued to develop a framework for targeted evaluations and the sharing of lessons learned to support continuous improvement. Efforts and investments continued to update our facilities, specialized equipment and tools, as well as to modernize our occupational health and safety and employee wellbeing programs.
In collaboration with the National Research Council of Canada, the TSB completed defining the requirements for its new laboratory and Head Office facility under the Laboratories Canada program.
Updating legislative and regulatory frameworks
One of the long-standing safety issues in the rail mode is the implementation of locomotive voice and video recorders (LVVR). These recorders are expected to provide valuable information to assist TSB investigators in their work . In 2018–19, Bill C-49 received royal assent thereby establishing the legal foundation to move forward. In 2019–20, the TSB continued to work in close collaboration with Transport Canada to put in place the required regulatory documents for the implementation of LVVR. In light of the legislative changes and the anticipated new regulations, the TSB reviewed and updated its own procedures pertaining to the handling of on-board recordings during its investigations. The TSB published its Policy on the Handling of On-board recordings in April 2020 to address the TSB’s physical handling of on-board recording equipment and the management of the information obtained from it.
Key Risks : things that could affect our ability to achieve our plans and results
The TSB faces key strategic risks that represent a potential threat to the achievement of its mandate. These risks warrant particular vigilance from all levels of the organization.
There is a risk that the TSB’s credibility and operational effectiveness could be impacted if it fails to keep pace with the technological changes in the transportation industry. The TSB operates within the context of a very large Canadian and international transportation system that is growing in complexity because of rapid technological changes. New designs, the increasing level of automation in operations and the introduction of remotely piloted devices into existing transportation systems are only some examples that highlight this challenging environment. Advances in technology are also leading to exponential growth in the data available for investigations and other safety analyses. The TSB must evolve to ensure new data sources are properly exploited, optimally managed and fully analyzed.
There is a risk that TSB employees do not have access to current workplace technology tools, systems, and applications to ensure that they can deliver their work in an efficient and effective manner. This includes having the appropriate IT infrastructure and applications in place, as well as the required Laboratory equipment. The TSB must make use of current versions of all IT operating systems/platforms and software applications in order to ensure the availability of maintenance and support from suppliers. As demonstrated during the COVID-19 pandemic, there is a strong need to ensure that these tools are not subject to business disruptions by third parties or other events.
Another challenge is the need to be vigilant with respect to managing employees and their wellbeing. Due to the nature of the work performed by the TSB, employees may be exposed to significant workplace stress and emotional trauma. TSB investigators are regularly exposed to accident sites involving injury and death, as well as to direct interaction with distraught survivors and families of victims. Vicarious trauma may also be experienced by other employees who are exposed to certain facets of investigations. Without a healthy workforce, the TSB would not be able to deliver its mandate and achieve its strategic objectives.
There is an operational readiness risk that could impair the TSB’s ability to deliver on its mandate in a continuous and on-going manner. There is a risk that the TSB may not be able to deploy in a timely manner, and to sustain operations, in the Arctic and remote regions due to the limited availability of transportation services and support infrastructure. Further, there is a risk that our planning and logistic support may not be appropriate for Arctic deployments and to command and control events at a major disaster site. These risks are compounded by the fact that there are many instances where there is only one person responsible for a specific task or with a specific expertise; should this person be unavailable it could put the organization at greater risk. The TSB has also encountered challenges in the recruitment and retention of experienced and qualified personnel in certain operational areas due to higher private sector salaries, a shortage of skilled workers, and the on-going retirement of the baby-boomer cohort of employees. Furthermore, due to the small size of its workforce, the TSB may not be able to handle two major occurrences at the same time.
Managing workload and expectations is a significant challenge. The TSB’s workload (volume of activities) is influenced by the number, severity and complexity of transportation occurrences, and the workload cannot be predicted effectively. This uncertainty poses certain challenges with respect to the planning and management of TSB resources which in turn can affect our ability to effectively deliver on our mandate. Over the past few years, the TSB’s visibility has increased significantly as a result of high-profile occurrence investigations, the TSB’s Outreach Program, and the increased use of social media to share safety information. Our solid reputation and enhanced visibility have generated higher stakeholder and public expectations, and these expectations are expected to continue to increase.
Another risk faced by the TSB is legal challenges to its business processes, powers of investigators and its legislation. As Canadian society becomes more litigious, people and organizations seek greater compensation for losses or damages. Litigants want timely information to file early lawsuits and seek resolution of their claims. This has resulted in an increase in the number of requests for TSB information not only through the Access to Information process but also through the Courts (Motions to disclose or to produce). These requests typically seek to obtain investigator notes, witness statements, draft documents, correspondence and other records for uses that are not necessarily consistent with the TSB mandate of advancing transportation safety. There has also been a greater push on the TSB to release privileged information such as on-board voice recordings and transcripts, as well as witness statements. If the TSB does not maintain robust investigation and IM processes which are applied consistently across the organization, as well as ensure the enforcement and compliance with its enabling legislation, there is a risk that the Courts could issue rulings that negatively impact on the way that the TSB conducts its work.
Experimentation
The TSB has not done any experimentation in 2020–21.
Results achieved
Accident rate
This indicator is measured as follows:
- For Air, the rate is the number of accidents per 100,000 hours flown in Canada (excluding ultralights and other aircraft types).
- For Marine, the rate is the number of shipping accidents involving Canadian-flag commercial vessels of 15 gross tons or more (excluding passenger vessels and fishing vessels) per million vessel-kilometres.
- For Pipeline, the rate is accidents per exajoule.
- For Rail, the rate is main-track accidents per million main-track train miles.
To determine whether the target for this indicator has been met, the accident rates for the current year are compared against the 10-year average. Where the current year result is below or is equal to the 10-year average, the target is identified as met. For Marine, the metric on vessel-kilometres is only available for 2015 to 2020. For this metric, where the current year result is below or is equal to the 5-year average, the target is identified as met.
Number of fatal accidents
This indicator is measured by comparing the number of fatal accidents for the current year against the 10-year average. Where the current year result equals the 10-year average, the target is identified as met.
Average time recommendations have been outstanding (active and dormant recommendations)
The target for this performance indicator is set annually to reflect realistic goals based on known circumstances at the time of planning.
Percentage of responses to recommendations assessed as Fully Satisfactory
The target for this performance indicator is set annually to reflect realistic goals based on known circumstances at the time of planning.
Average time to complete a class 4 limited-scope investigation
Starting in fiscal year 2020–21, the target for this performance indicator was changed from “200 days” to “220 days” to reflect amendments to the TSB Policy on Occurrence Classification.
Program outcome indicators
The TSB currently measures its departmental results and program outcomes using the same set of indicators.
Results achieved: Air
| Departmental results | Performance indicators | Target | Date to achieve target | 2018–19 Actual results | 2019–20 Actual results | 2020–21 Actual results |
|---|---|---|---|---|---|---|
| Transportation system is safer | Accident rate (over 10-year period) | Continue downward trend in accident rate | March 2021 | Met There has been a significant downward trend in the accident rate for Canadian-registered aircraft over the past 10 years. The aviation accident rate in 2018 was 3.5 accidents per 100,000 hours flown, below the 10-year average of 5.2. |
Met There has been a significant downward trend in the accident rate for Canadian-registered aircraft over the past 10 years. The aviation accident rate in 2019 was 3.7 accidents per 100,000 hours flown, below the 10-year average of 4.9. |
Not met There has been a downward trend in the accident rate for Canadian-registered aircraft over the past 10 years. The aviation accident rate in 2020 was 5.8 accidents per 100,000 hours flown, above the 10-year average of 4.7. |
| Transportation system is safer | Number of fatal accidents (over 10-year period) | Reduction in number of fatal accidents | March 2021 | Met The number of fatal accidents was 23, below the 10-year average of 32 and fatalities in 2018 totalled 38, lower than the 10-year average of 55. |
Not met The number of fatal accidents was 33, higher than the 10-year average of 30 and fatalities in 2019 totalled 70, higher than the 10-year average of 52. |
Met The number of fatal accidents was 12, lower than the 10-year average of 30, and fatalities in 2020 totalled 16, lower than the 10-year average of 52. |
| The regulators and the transportation industry respond to identified safety deficiencies | Percentage of responses to recommendations assessed as Fully Satisfactory | 78% | March 2021 | Met 75% |
Met 77% |
Met 78% |
| The regulators and the transportation industry respond to identified safety deficiencies | Percentage of safety advisories on which safety actions have been taken | 75% | March 2021 | Met 75% |
Met 100% |
Met 75% |
| The regulators and the transportation industry respond to identified safety deficiencies | Average time recommendations have been outstanding (active and dormant recommendations) | 10.5 years | March 2021 | Met 11 years |
Met 10.5 years |
Not met 11 years |
| Occurrence investigations are efficient | Average time to complete a class 1 safety issue investigation | 730 days | March 2021 | Met 689 days |
Not met 1696 days |
Not applicable |
| Occurrence investigations are efficient | Average time to complete a class 2 complex investigation | 600 days | March 2021 | Met 550 days |
Not met 686 days |
Not met 704 days |
| Occurrence investigations are efficient | Average time to complete a class 3 detailed investigation | 450 days | March 2021 | Met 447 days |
Met 428 days |
Not met 488 days |
| Occurrence investigations are efficient | Average time to complete a class 4 limited-scope investigation | 220 days | March 2021 | Met 192 days |
Not met 212 days |
Met 198 days |
| Occurrence investigations are efficient | Average time to complete a class 5 data-gathering investigation | 60 days | March 2021 | Met 14 days |
Met 39 days |
Not met 70 days |
Results achieved: Marine
| Departmental results | Performance indicators | Target | Date to achieve target | 2018–19 Actual results | 2019–20 Actual results | 2020–21 Actual results |
|---|---|---|---|---|---|---|
| Transportation system is safer | Accident rate (over 10-year period) | Continue downward trend in accident rate | March 2021 | Met The marine accident rates in 2018 were: |
Not met The marine accident rates in 2019 were: |
Not met The marine accident rates in 2020 were: |
| Transportation system is safer | Number of fatal accidents (over 10-year period) | Reduction in number of fatal accidents | March 2021 | Not met The number of fatal accidents was 14, above the 10-year average of 11.9 and the number of fatalities in 2018 totalled 22, above the 10-year average of 16.0. |
Not met The number of fatal accidents was 13, above the 10-year average of 11.3 and the number of fatalities in 2019 totalled 17, above the 10-year average of 15.2. |
Not met The number of fatal accidents was 9, below the 10-year average of 11.3, but the number of fatalities in 2020 totalled 18, above the 10-year average of 15.4. |
| The regulators and the transportation industry respond to identified safety deficiencies | Percentage of responses to recommendations assessed as Fully Satisfactory | 84% | March 2021 | Not met 83% |
Met 85% |
Met 87% |
| The regulators and the transportation industry respond to identified safety deficiencies | Percentage of safety advisories on which safety actions have been taken | 60% | March 2021 | Met 60% |
Not met 33% |
Not met 0% |
| The regulators and the transportation industry respond to identified safety deficiencies | Average time recommendations have been outstanding (active and dormant recommendations) | 10 years | March 2021 | Met 10.6 years |
Not met 10.6 years |
Not met 11 years |
| Occurrence investigations are efficient | Average time to complete a class 1 safety issue investigation | 730 days | March 2021 | Not applicable | Not applicable | Not applicable |
| Occurrence investigations are efficient | Average time to complete a class 2 complex investigation | 600 days | March 2021 | Met 574 days |
Not applicable | Not met 953 days |
| Occurrence investigations are efficient | Average time to complete a class 3 detailed investigation | 450 days | March 2021 | Met 417 days |
Not met 548 days |
Not met 708 days |
| Occurrence investigations are efficient | Average time to complete a class 4 limited-scope investigation | 220 days | March 2021 | Not met 294 days |
Not met 341 days |
Not met 370 days |
| Occurrence investigations are efficient | Average time to complete a class 5 data-gathering investigation | 60 days | March 2021 | Met 52 days |
Met 30 days |
Met 50 days |
Results achieved: Pipeline
| Departmental results | Performance indicators | Target | Date to achieve target | 2018–19 Actual results | 2019–20 Actual results | 2020–21 Actual results |
|---|---|---|---|---|---|---|
| Transportation system is safer | Accident rate (over 10-year period) | Continue downward trend in accident rate | March 2021 | Met The 2018 rate was 0.06 pipeline accidents per exajoule, below the 10-year average of 0.3. |
Met The 2019 rate was 0.0 pipeline accidents per exajoule, below the 10-year average of 0.4. |
Met The 2020 rate was 0.0 pipeline accidents per exajoule, below the 10-year average of 0.3. |
| The regulators and the transportation industry respond to identified safety deficiencies | Percentage of responses to recommendations assessed as Fully Satisfactory | 100% | March 2021 | Met 100% |
Met 100% |
Met 100% |
| The regulators and the transportation industry respond to identified safety deficiencies | Percentage of safety advisories on which safety actions have been taken | 75% | March 2021 | Not applicable | Met 100% |
Not applicable |
| The regulators and the transportation industry respond to identified safety deficiencies | Average time recommendations have been outstanding (active and dormant recommendations) | 7 years | March 2021 | Not applicable | Not applicable | Not applicable |
| Occurrence investigations are efficient | Average time to complete a class 1 safety issue investigation | 730 days | March 2021 | Not applicable | Not applicable | Not applicable |
| Occurrence investigations are efficient | Average time to complete a class 2 complex investigation | 600 days | March 2021 | Not applicable | Not applicable | Not applicable |
| Occurrence investigations are efficient | Average time to complete a class 3 detailed investigation | 450 days | March 2021 | Not met 522 days |
Not met 513 days |
Not applicable |
| Occurrence investigations are efficient | Average time to complete a class 4 limited-scope investigation | 220 days | March 2021 | Not met 264 days |
Not applicable | Not met 279 days |
| Occurrence investigations are efficient | Average time to complete a class 5 data-gathering investigation | 60 days | March 2021 | Not met 165 days |
Not met 62 days |
Not met 171 days |
Results achieved: Rail
| Departmental results | Performance indicators | Target | Date to achieve target | 2018–19 Actual results | 2019–20 Actual results | 2020–21 Actual results |
|---|---|---|---|---|---|---|
| Transportation system is safer | Accident rate (over 10-year period) | Continue downward trend in accident rate | March 2021 | Not met The main-track accident rate in 2018 was 2.6 accidents per million main-track train miles, above the 10-year average of 2.3. |
Not met The main-track accident rate in 2019 was 3.3 accidents per million main-track train miles, above the 10-year average of 2.3. |
Not met The main-track accident rate in 2020 was 2.7 accidents per million main-track train miles, above the 10-year average of 2.4. |
| Transportation system is safer | Number of fatal accidents (over 10-year period) | Reduction in number of fatal accidents | March 2021 | Met Rail fatalities totalled 57 in 2018, below the 10-year average of 74. |
Not met Rail fatalities totalled 72 in 2019, below the 10-year average of 72.8. |
Met Rail fatalities totalled 59 in 2020, below the 10-year average of 73. |
| The regulators and the transportation industry respond to identified safety deficiencies | Percentage of responses to recommendations assessed as Fully Satisfactory | 88% | March 2021 | Met 88% |
Met 90% |
Met 91% |
| The regulators and the transportation industry respond to identified safety deficiencies | Percentage of safety advisories on which safety actions have been taken | 60% | March 2021 | Not met 11% |
Not met 11% |
Not met 13% |
| The regulators and the transportation industry respond to identified safety deficiencies | Average time recommendations have been outstanding (active and dormant recommendations) | 7 years | March 2021 | Not met 7.8 years |
Not met 9.2 years |
Not met 9.5 years |
| Occurrence investigations are efficient | Average time to complete a class 1 safety issue investigation | 730 days | March 2021 | Not applicable | Not applicable | Not applicable |
| Occurrence investigations are efficient | Average time to complete a class 2 complex investigation | 600 days | March 2021 | Not met 672 days |
Not applicable | Not met 811 days |
| Occurrence investigations are efficient | Average time to complete a class 3 detailed investigation | 450 days | March 2021 | Met 447 days |
Not met 520 days |
Not met 540 days |
| Occurrence investigations are efficient | Average time to complete a class 4 limited-scope investigation | 220 days | March 2021 | Not met 214 days |
Not met 219 days |
Not met 374 days |
| Occurrence investigations are efficient | Average time to complete a class 5 data-gathering investigation | 60 days | March 2021 | Met 51 days |
Not met 105 days |
Not met 93 days |
Budgetary financial resources (dollars)
| 2020–21 Main Estimates |
2020–21 Planned spending |
2020–21 Total authorities available for use |
2020–21 Actual spending (authorities used) |
2020–21 Difference (Actual spending minus Planned spending) |
|---|---|---|---|---|
| 26,886,508 | 26,886,508 | 29,248,825 | 28,397,258 | 1,510,750 |
Human resources (full-time equivalents)
| 2020–21 Planned full-time equivalents |
2020–21 Actual full-time equivalents |
2020–21 Difference (Actual full-time equivalents minus Planned full-time equivalents) |
|---|---|---|
| 177 | 174 | (3) |
Financial, human resources and performance information for the TSB’s Program Inventory is available in GC InfoBase.Footnote iv
Internal Services
Description
Internal Services are those groups of related activities and resources that the federal government considers to be services in support of programs and/or required to meet corporate obligations of an organization. Internal Services refers to the activities and resources of the 10 distinct service categories that support Program delivery in the organization, regardless of the Internal Services delivery model in a department. The 10 service categories are:
- Acquisition Management Services
- Communication Services
- Financial Management Services
- Human Resources Management Services
- Information Management Services
- Information Technology Services
- Legal Services
- Material Management Services
- Management and Oversight Services
- Real Property Management Services
Results
To continue to improve delivery of its services and to facilitate remote work, a number of processes were migrated to a fully digital environment.
The rapid and effective rollout of e-signatures initiated in March 2020, the migration to an MS Teams environment and the numerous related adjustments to various other corporate systems allowed the TSB to continue functioning at a solid pace, with minimal overall impact on productivity.
In 2020–21, the GCdocs document management system was rolled-out which allowed the TSB to work in a paperless environment, further facilitating remote work arrangements during the pandemic. The organization also worked on its transition from a legacy accounting system to the SAP platform, thereby aligning the TSB to Government of Canada standard systems. The transition to the cloud environment was also initiated.
The TSB’s HR division supported diversity and inclusion initiatives as well as other initiatives that affect employee wellbeing. Progress on theses initiatives formed part of our departmental response to the Clerk’s Call to Action on Anti-Racism, Equity and Inclusion. New staffing tools were also made available to managers in 2020–21.
The TSB’s Finance division continued to work in collaboration with its HR division and PSPC compensation personnel to ensure that Phoenix issues were minimized and employees were paid in a timely manner. Where appropriate, cash advances were issued to employees. Lastly, the project to co-locate the TSB’s Head Office and Engineering Lab in a modern facility within the National Capital Region through participation in the Laboratories Canada program is continuing to progress as planned.
Budgetary financial resources (dollars)
| 2020–21 Main Estimates |
2020–21 Planned spending |
2020–21 Total authorities available for use |
2020–21 Actual spending (authorities used) |
2020–21 Difference (Actual spending minus Planned spending) |
|---|---|---|---|---|
| 6,721,627 | 6,721,627 | 8,215,701 | 7,976,504 | 1,254,877 |
Human resources (full-time equivalents)
| 2020–21 Planned full-time equivalents |
2020–21 Actual full-time equivalents |
2020–21 Difference (Actual full-time equivalents minus Planned full-time equivalents) |
|---|---|---|
| 50 | 50 | 0 |
Analysis of trends in spending and human resources
Actual expenditures
Departmental spending trend graph
The following graph presents planned (voted and statutory spending) over time.
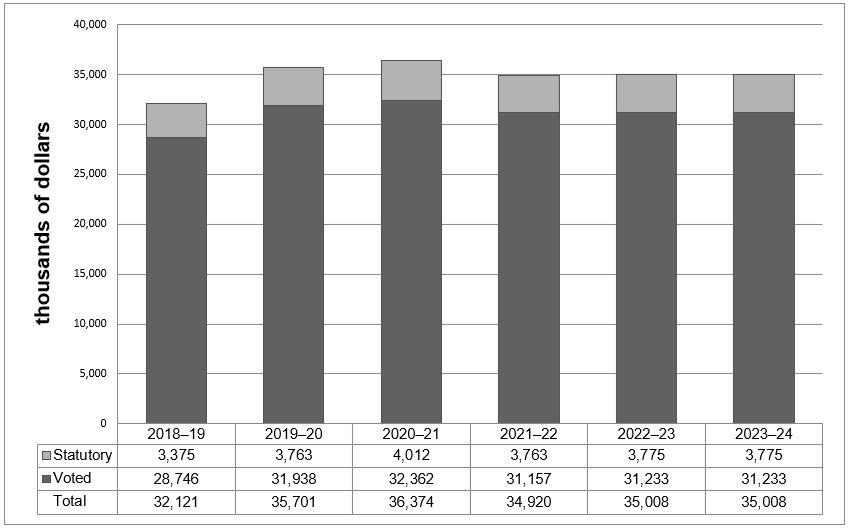
The departmental spending trend graph shows actual spending (2018–19 to 2020–21) and planned spending (2021–22 to 2023–24). The variation in statutory amounts over the years is directly attributable to Employee Benefit Plan allocations associated to employee salaries. Further trend analysis related to this table is provided in the following section.
Budgetary performance summary for Core Responsibilities and Internal Services (dollars)
| Core responsibilities and Internal Services | 2020–21 Main Estimates |
2020–21 Planned spending |
2021–22 Planned spending |
2022–23 Planned spending |
2020–21 Total authorities available for use |
2018–19 Actual spending (authorities used) | 2019–20 Actual spending (authorities used) | 2020–21 Actual spending (authorities used) |
|---|---|---|---|---|---|---|---|---|
| Independent safety investigations and communication of risks in the transportation system | 26,886,508 | 26,886,508 | 27,936,216 | 28,006,661 | 29,248,825 | 25,337,317 | 28,806,211 | 28,397,258 |
| Internal Services | 6,721,627 | 6,721,627 | 6,984,054 | 7,001,665 | 8,215,701 | 6,783,585 | 6,894,275 | 7,976,504 |
| Total | 33,608,135 | 33,608,135 | 34,920,270 | 35,008,326 | 37,464,526 | 32,120,902 | 35,700,486 | 36,373,762 |
The 2018–19 to 2020–21 actual spending results are actual amounts as published in the Public Accounts of Canada. The significant increase in actual spending in 2019–20 and 2020–21 when compared to 2018–19 is mainly due to higher salary expenditures in the form of retroactive payments for previous years as well as current year wage increases. These increases are in accordance with signed and ratified collective agreements.
The significant increase of $3.9M between 2020–21 planned spending and 2020–21 total authorities (available for use) is explained by the additional authorities the TSB received throughout the fiscal year:
- $2.1M for compensation allocations and funding for Phoenix damages
- $1.0M for its operating budget carry forward from 2019–20
- $0.4M for associated Employee Benefit Plans (EBP) amounts
- $0.3M as a result of its Memorandum of Understanding (MOU) with Laboratories Canada
The remaining $0.1M is comprised of the gains from the sale of capital assets which was not included in planned spending or Main Estimates.
In accordance with the definition of planned spending, planned amounts for 2020–21 and ongoing fiscal years consist of Main Estimates and Annual Reference Level amounts only. The increase in planned spending for 2021–22 ($1.3M) and 2022–23 ($1.4M) when compared to 2020–21 Main Estimates is primarily due to compensation allocations for collective agreement wage increases that were approved in previous years but are now being included in ARLU and Main Estimates.
Actual human resources
Human resources summary for core responsibilities and Internal Services
| Core responsibilities and Internal Services | 2018–19 Actual full-time equivalents | 2019–20 Actual full-time equivalents | 2020–21 Planned full-time equivalents |
2020–21 Actual full-time equivalents | 2021–22 Planned full-time equivalents | 2022–23 Planned full-time equivalents |
|---|---|---|---|---|---|---|
| Independent safety investigations and communication of risks in the transportation system | 163 | 173 | 177 | 174 | 177 | 177 |
| Internal Services | 46 | 47 | 50 | 50 | 50 | 50 |
| Total | 209 | 220 | 227 | 224 | 227 | 227 |
Actual full-time equivalents (FTEs) for 2018–19 and prior years were less than the anticipated due to vacant positions. Actual FTEs for 2019–20 are only slightly under the 2019–20 planned figure of 222 FTEs. As a result of continued vacancy filling as well as some internal reorganizations, the TSB’s planned FTEs increased to 227 starting in 2020–21. The 2020–21 actuals were very close to planned at 224 FTEs.
Expenditures by vote
For information on the TSB’s organizational voted and statutory expenditures, consult the Public Accounts of Canada 2020–2021.Footnote v
Government of Canada spending and activities
Information on the alignment of the TSB’s spending with the Government of Canada’s spending and activities is available in GC InfoBase.Footnote vi
Financial statements and financial statements highlights
Financial statements
The TSB’s financial statements (unaudited) for the year ended March 31, 2021, are available on the departmental website.Footnote vii
Financial statement highlights
Condensed Statement of Operations (unaudited) for the year ended March 31, 2021 (thousands of dollars)
| Financial information | 2020–21 Planned results | 2020–21 Actual results | 2019–20 Actual results | Difference (2020–21 Actual results minus 2020–21 Planned results) |
Difference (2020–21 Actual results minus 2019–20 Actual results) |
|---|---|---|---|---|---|
| Total expenses | 38,395 | 40,206 | 40,411 | 1,811 | (205) |
| Total revenues | 35 | 13 | 28 | (22) | (15) |
| Net cost of operations before government funding and transfers | 38,360 | 40,193 | 40,383 | 1,833 | (190) |
The 2020–21 Planned Results are based on estimates known at the time of preparation of the Departmental Plan and as presented in the Future-Oriented Statement of Operations. Footnote viii As such, the Planned Results exclude additional funding for compensation adjustments as a result of signed and ratified collective agreements as well as additional funding provided for the implementation of Phoenix pay system damages agreement for employees. For this reason, the planned expenses for 2020–21 were estimated at $38.4M while actual expenses are higher at $40.2M.
On an accrual accounting basis, the TSB’s total operating expenses have decreased by $0.2M from $40.4M in 2019–20 to $40.2M in 2020–21. Despite a $1.6M increase in employee salaries, the global COVID-19 pandemic situation and the subsequent travel restrictions have affected TSB’s regular operations and spending patterns, resulting in significantly lower operating expenses in the areas of transportation and communications and, to a lesser degree, professional and special services.
The TSB’s revenues are incidental and are mainly the result of the rebate received from its supplier for the use of its TSB acquisition cards in 2020–21.
Condensed Statement of Financial Position (unaudited) as of March 31, 2021 (in thousands of dollars)
| Financial information | 2020–21 | 2019–20 | Difference (2020–21 minus 2019–20) |
|---|---|---|---|
| Total net liabilities | 6,566 | 8,110 | (1,544) |
| Total net financial assets | 2,595 | 4,633 | (2,038) |
| Departmental net debt | 3,971 | 3,477 | 494 |
| Total non-financial assets | 5,938 | 4,870 | 1,068 |
| Departmental net financial position | 1,967 | 1,393 | 574 |
The TSB’s total net liabilities consist primarily of accounts payable and accrued liabilities relating to operations which account for $2.7M or 42% (62% in 2019–20) and vacation pay and compensatory leave which account for $2.9M or 45% (24% in 2019–20) of total liabilities. The liability for employee future benefits pertaining to severance pay represents $0.9M or 14% (14% in 2019–20) of total liabilities. The overall decrease in net liabilities between years is primarily attributed to the large year-end retroactive amounts resulting from the signed and ratified collective agreement for the AO-CAI classification that were outstanding at the end of the 2019–20 fiscal year. This liability was discharged in 2020–21 as these amounts were paid out to employees at the start of the fiscal year. Offsetting this amount is a smaller increase in vacation and compensatory leave, which is the result of the deferral of the mandatory cash-outs of excess vacation and compensatory leave for the fourth straight year.
Total net financial assets consist of accounts receivable, advances, and amounts due from the Consolidated Revenue Fund (CRF) of the Government of Canada. The amount due from the CRF represents 95% or $2.5M (93% in 2019–20) of the year-end balance, and a decrease of $1.8M when compared to previous year. This represents a decrease in the amount of net cash that the TSB is entitled to draw from the CRF in the future to discharge its current liabilities without further appropriations. The TSB’s total net financial assets have decreased by $2.0M between years mainly due to the lower amount due from the CRF.
Total non-financial assets consist primarily of tangible capital assets, which make up $5.7M or 97% of the balance (97% in 2019–20), with inventory and prepaid expenses accounting for the remaining 3%. The increase of $1.1M in non-financial assets between years is mainly due to the annual amortization ($1.1M) which is offset by the acquisition of new assets ($2.2M).
Corporate information
Organizational profile
Appropriate minister: The Honourable William Blair P.C., C.O.M., M.P.
Institutional head: Kathleen Fox
Ministerial portfolio: Privy Council
Enabling instrument: Canadian Transportation Accident Investigation and Safety Board Act,Footnote ixS.C. 1989, c. 3
Year of incorporation / commencement: 1990
Raison d’être, mandate and role: who we are and what we do
“Raison d’être, mandate and role: who we are and what we do” is available on the TSB’s website.Footnote x
Operating context
Information on the operating context is available on the TSB’s website.Footnote xi
Reporting framework
The TSB’s Departmental Results Framework and Program Inventory of record for 2020–21 are shown as follows.

Supporting information on the program inventory
Financial, human resources and performance information for the TSB’s Program Inventory is available in GC InfoBase.Footnote xii
Supplementary information tables
The following supplementary information tables are available on the TSB’s website:
Federal tax expenditures
The tax system can be used to achieve public policy objectives through the application of special measures such as low tax rates, exemptions, deductions, deferrals and credits. The Department of Finance Canada publishes cost estimates and projections for these measures each year in the Report on Federal Tax Expenditures.Footnote xv This report also provides detailed background information on tax expenditures, including descriptions, objectives, historical information and references to related federal spending programs as well as evaluations and GBA Plus of tax expenditures.
Organizational contact information
Mailing address
Transportation Safety Board of Canada
Place du Centre, 4th floor
200 Promenade du Portage
Gatineau, Quebec K1A 1K8
Telephone: 1-800-387-3557
Email: communications@bst-tsb.gc.caFootnote xvi
Website(s): www.bst-tsb.gc.caFootnote xvii
Appendix: Definitions
appropriation (crédit)
Any authority of Parliament to pay money out of the Consolidated Revenue Fund.
budgetary expenditures (dépenses budgétaires)
Operating and capital expenditures; transfer payments to other levels of government, organizations or individuals; and payments to Crown corporations.
core responsibility(responsabilité essentielle)
An enduring function or role performed by a department. The intentions of the department with respect to a core responsibility are reflected in one or more related departmental results that the department seeks to contribute to or influence.
Departmental Plan (plan ministériel)
A report on the plans and expected performance of an appropriated department over a 3-year period. Departmental Plans are usually tabled in Parliament each spring.
departmental priority (priorité ministérielle)
A plan or project that a department has chosen to focus and report on during the planning period. Priorities represent the things that are most important or what must be done first to support the achievement of the desired departmental results.
departmental result (résultat ministériel)
A consequence or outcome that a department seeks to achieve. A departmental result is often outside departments’ immediate control, but it should be influenced by program-level outcomes.
departmental result indicator (indicateur de résultat ministériel)
A quantitative measure of progress on a departmental result.
departmental results framework (cadre ministériel des résultats)
A framework that connects the department’s core responsibilities to its departmental results and departmental result indicators.
Departmental Results Report (rapport sur les résultats ministériels)
A report on a department’s actual accomplishments against the plans, priorities and expected results set out in the corresponding Departmental Plan.
experimentation (expérimentation)
The conducting of activities that seek to first explore, then test and compare the effects and impacts of policies and interventions in order to inform evidence-based decision-making, and improve outcomes for Canadians, by learning what works, for whom and in what circumstances. Experimentation is related to, but distinct from innovation (the trying of new things), because it involves a rigorous comparison of results. For example, using a new website to communicate with Canadians can be an innovation; systematically testing the new website against existing outreach tools or an old website to see which one leads to more engagement, is experimentation.
full-time equivalent (équivalent temps plein)
A measure of the extent to which an employee represents a full person-year charge against a departmental budget. For a particular position, the full-time equivalent figure is the ratio of number of hours the person actually works divided by the standard number of hours set out in the person’s collective agreement.
gender-based analysis plus (GBA Plus) (analyse comparative entre les sexes plus [ACS Plus])
An analytical process used to assess how diverse groups of women, men and gender-diverse people experience policies, programs and services based on multiple factors including race ethnicity, religion, age, and mental or physical disability.
government-wide priorities (priorités pangouvernementales)
For the purpose of the 2020–21 Departmental Results Report, those high-level themes outlining the government’s agenda in the 2019 Speech from the Throne, namely: Fighting climate change; Strengthening the Middle Class; Walking the road of reconciliation; Keeping Canadians safe and healthy; and Positioning Canada for success in an uncertain world.
horizontal initiative (initiative horizontale)
An initiative where two or more federal organizations are given funding to pursue a shared outcome, often linked to a government priority.
non-budgetary expenditures (dépenses non budgétaires)
Net outlays and receipts related to loans, investments and advances, which change the composition of the financial assets of the Government of Canada.
performance (rendement)
What an organization did with its resources to achieve its results, how well those results compare to what the organization intended to achieve, and how well lessons learned have been identified.
performance indicator(indicateur de rendement)
A qualitative or quantitative means of measuring an output or outcome, with the intention of gauging the performance of an organization, program, policy or initiative respecting expected results.
performance reporting(production de rapports sur le rendement)
The process of communicating evidence-based performance information. Performance reporting supports decision making, accountability and transparency.
plan(plan)
The articulation of strategic choices, which provides information on how an organization intends to achieve its priorities and associated results. Generally, a plan will explain the logic behind the strategies chosen and tend to focus on actions that lead to the expected result.
planned spending(dépenses prévues)
For Departmental Plans and Departmental Results Reports, planned spending refers to those amounts presented in Main Estimates.
A department is expected to be aware of the authorities that it has sought and received. The determination of planned spending is a departmental responsibility, and departments must be able to defend the expenditure and accrual numbers presented in their Departmental Plans and Departmental Results Reports.
program (programme)
Individual or groups of services, activities or combinations thereof that are managed together within the department and focus on a specific set of outputs, outcomes or service levels.
program inventory (répertoire des programmes)
Identifies all the department’s programs and describes how resources are organized to contribute to the department’s core responsibilities and results.
result (résultat)
A consequence attributed, in part, to an organization, policy, program or initiative. Results are not within the control of a single organization, policy, program or initiative; instead they are within the area of the organization’s influence.
statutory expenditures (dépenses législatives)
Expenditures that Parliament has approved through legislation other than appropriation acts. The legislation sets out the purpose of the expenditures and the terms and conditions under which they may be made.
target (cible)
A measurable performance or success level that an organization, program or initiative plans to achieve within a specified time period. Targets can be either quantitative or qualitative.
voted expenditures (dépenses votées)
Expenditures that Parliament approves annually through an appropriation act. The vote wording becomes the governing conditions under which these expenditures may be made.